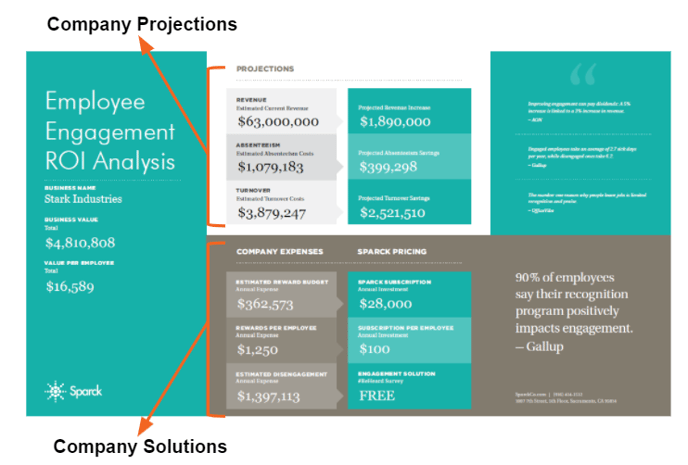
Now that we’ve reviewed all of the projected savings and increases, it's time to look at existing company expenses and suggested engagement solutions to start capturing the financial upsides in the Projections section. The Solutions are the second part of the ROI Analysis, which are in the gray box at the bottom. This is a great time to start putting together a plan of action to seal the deal and start turning things around with new engagement strategies.
In this section, we focus on these solution and budget areas:
- Employee Recognition & Rewards
- Recommended department budget
- Recommended budget per employee
- Employee Engagement Survey - Recommended to get accurate engagement data
Employee Recognition & Rewards
You may be surprised to see such an emphasis on employee recognition, but it plays such an essential role in employee engagement. It’s one of the most effective drivers when done right. 90% of employees say that recognition is what helps drive more engagement in the workplace, yet nearly 8 out of 10 employees resign due to not being recognized enough.
Remember the Turnover Section of the ROI Analysis that showed potential savings because 65% of employees who quit do so voluntarily? Research shows that a lack of appreciation was a huge part of those outcomes. It’s human nature! People are hungry to feel valued, and employee recognition will pay off tremendously as part of your engagement strategy.
Here are a few common questions that we'll address:
- What should we include in a recognition program?
- How much should we budget for a recognition program?
What Should be Included in a Recognition Program?
Let’s start with the first question. Depending on the company culture, there are a variety of options. It’s important to align the program to recognize and reinforce the desired success behaviors needed to reach company goals and objectives. This will be unique to each company.
Here's a list of success behaviors you may want to reinforce. We've excluded employee raises and bonuses because they are typically not included in a recognition program.
|
Include |
Don’t Include |
|
|
This is a very intentional process and one that can’t be determined out in a single meeting. A one-size-fits-all recognition plan won’t work. You have to take the time to understand the employees in the R&R division. It’s critical to acknowledge that everyone is different and the reward and recognition strategies will likely differ between generations and position type.
The rewards and perks that will mean the most for someone straight out of college who loves adventure will look very different compared to someone who is established in a career and enjoys family time. We couldn’t stress enough that their recognition program should be as diverse and as unique as their employees.
Building a recognition program is an entirely different topic though, and we’re just scratching the surface here. Coming soon, we can help you build your unique recognition program!
How Much Should we Budget for a Recognition Program?
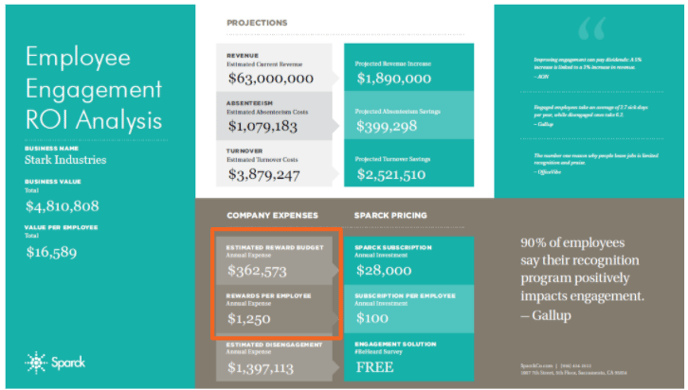
Now, for the second question. Research shows that US employers spend an average of 1% - 2% of an employee’s annual salary on company rewards and perks for the year. Because of this, we use 1.5% as an overall average to calculate an estimated annual reward budget in the ROI Analysis. We multiple the 1.5% by the average salary to get the budget per employee. And then multiply that by the number of employees in the division for the total budget. This automatically populates in the Sparck calculator.
Here''s the formula to calculate the Reward Budget per Employee::
- Average Salary x 1.5%
- $83,350 x 1.5% = $1,250
1.5% is just a national average to serve as a baseline to help formulate a budget that works best for them. By having the budget per employee, it also gives you a great benchmark for budgeting.
Here's the formula to calculate the Annual Budget:
- Reward Budget per Employee x Number of Employees
- $1,250 x 290 = $362,500.
It's helpful to include both the total annual reward budget and the budget per employee to give your executive team a more realistic view of the minimal investment that’s needed for this engagement solution.
The great thing about numbers is it gives a clear picture of what can be gained at a nominal cost. For example, if you want to move forward with an annual subscription to the Sparck #BeSeen Recognition Platform to personalize their program, the cost of $28,000 is just a fraction of the recommended annual reward budget of $362,573. If the platform helped retain only one employee during the year, it would easily cover the subscription cost and far more.
Annual Disengagement Costs & Employee Surveys
Here we are on the last section - time to wrap it up! Let’s talk about the financial impact of disengagement in your workforce.
Sadly, as we mentioned before, Gallup has found that an average of 17% of the workforce is highly disengaged. YIKES!
These are the employees who are most likely showing up late, missing deadlines, and surfing the internet for open positions at work. This probably won’t come as a shock, but disengaged employees aren’t working as hard as those who are engaged and it’s losing the department a lot of money. On average a disengaged employee is costing the department 34% in lost productivity.
Let's take a look at our example:
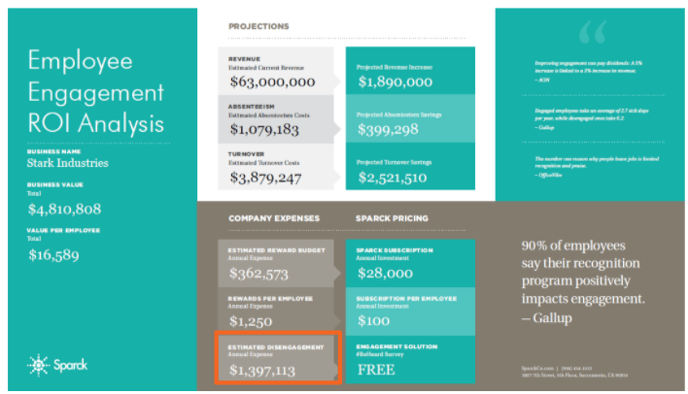
This company is losing an estimated $1,397,113 a year in lost productivity due to employee disengagement.
Here's the formula for Annual Disengagement Costs:
- (Average Salary x 34%) x (Number of Disengaged Employees)
- ($83,350 x 34%) x (49) = $1,397,113
Free Employee Engagement Survey
The great news is that there’s an opportunity to turn that around! Engagement strategies can capture their commitment and excitement again, but do you know how engaged your employees are? Do you have more disengagement than the national average?
We have a free version of our #BeHeard Report to help you get an accurate engagement benchmark at no cost. This information will be priceless as you weave engagement into your business strategies to really measure progress and outcomes.
Next Steps:
- Go back to the ROI Analysis Toolkit to learn more about the different sections of the ROI Analysis.
- Learn more about the FREE #BeHeard Report to get a benchmark on engagement.
- Set up a time to chat with us about your ROI Analysis Results or the #BeHeard Survey.